
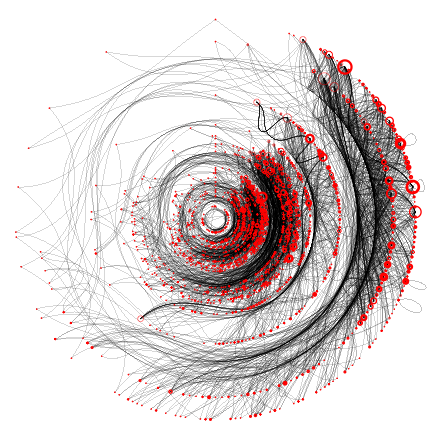
A numerical value is assigned to every letter of the alphabet. Adding the values of all letters, one gets a number that represents the overall word. Using this system, an entire poem is arranged on a circular path. The diameter of the circle is based on the length of the poem.
Data visualizations are methods for creating images, diagrams, or animations to communicate specific messages—representational or absctract. These visualizations provide us with a way to understand a specific part of reality better, or at least see it in a different way.

Visualization of personal music listening history by Lee Byron
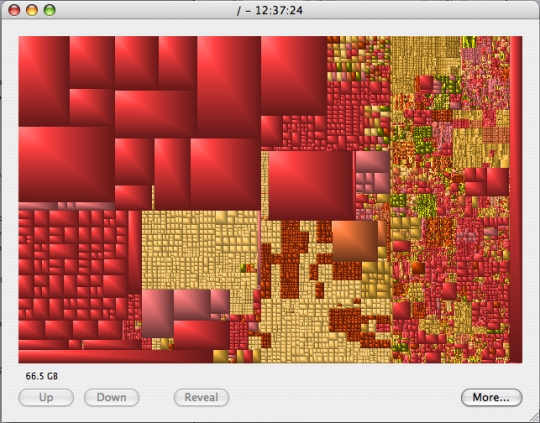
You can download this cool utility called GrandPerspective that analyzes the contents of your harddrive and creates a visual representation of all the files according to their size. Then you can color code them in different ways. I have it color coded by file extensions. The big red ones are video files.